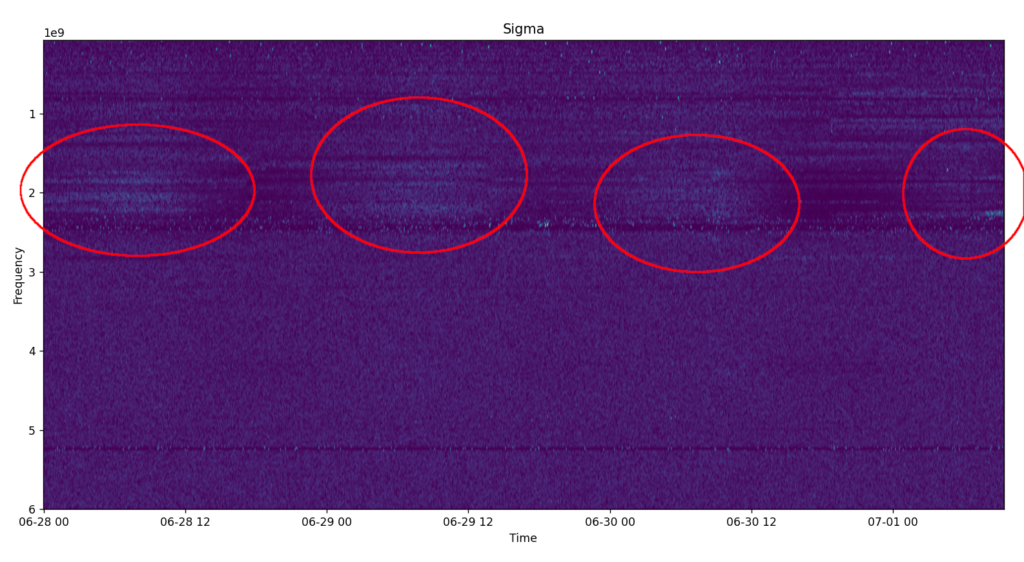
I was looking at the last few days since all that interference like energy dropped in magnitude. I noticed I’m seeing a daily change. I tried to get all my circles the same size but wasn’t easy. In any case, each point of maximum is about 0700 on the dot. The minimum is about 1800.
The position of the sun is one possible reason. It would then be peaking about 2 hours after sunrise and reaching normal 2 hours after sunset. Yet, it would make more sense for it to reach normal when the sun was on the other side of the Earth. Therefore, I’m not sure the sun is the cause.
The humidity might be to blame. Therefore, it is possible that humidity is playing a role or some other atmospheric process. It could be attenuating background energy in that region.
It could be related to temperature which is indirectly related to the sun such that around 0700 the water molecules begin to spread apart because of the rising temperature and perhaps since it is early water has not had a chance to evaporate into the atmosphere. By the time 1800 approaches the air is becoming saturated and temperatures are dropping bringing the water molecules closer together attenuating background energy.
The frequency range is about 1.69ghz to 2.34ghz.
There is also variation. The sun should create almost the exact same pattern over a short period of a few days, but something based on humidity and temperature could vary alot day to day.
Using the humidity model, it would seem that on 7-1 the humidity must have been very high in the morning because the energy is attenuated much more than on previous days.
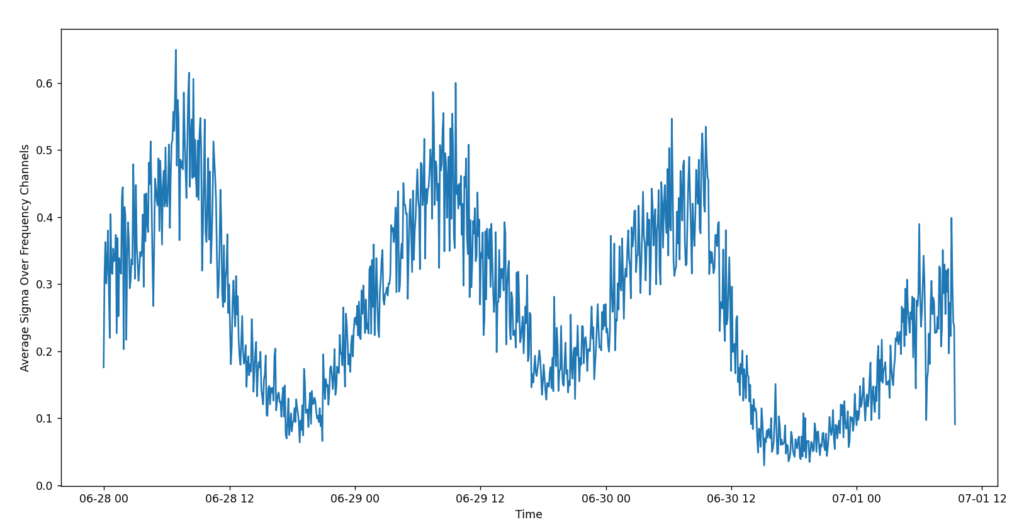
I extracted the specific region and then averaged across the frequencies to produce the above graph. You can more clearly see the cyclic nature. It is also easier to see the specific relative magnitude.
It is as if there is a small window of time at 0700 hours where the background energy in that frequency band is highest.
I don’t think it is the sun because it’s black body radiation should be fairly flat at these frequencies, and it is obvious this region is only about 700mhz wide. Yet, the antennas are in a room with a window to the East, so the timing does well match the sun rising from the horizon. Yet, I’d expect a much sharper drop off as the sun rose above the line of sight for the window. Also, once again, the energy levels are not consistent from day to day.
I really suspect humidity and perhaps that range of frequencies is just absorbed by water vapor really well. I might like to revise my humidity theory and say instead that what is happening is the humidity is dropping after 1800 and it continues to drop until about 0700 where it starts to rise because of the rising sun causing more water vapor to rise into the air. That the daily variance in magnitude is due to there being differing amounts of water vapor in the air each morning at 0700.
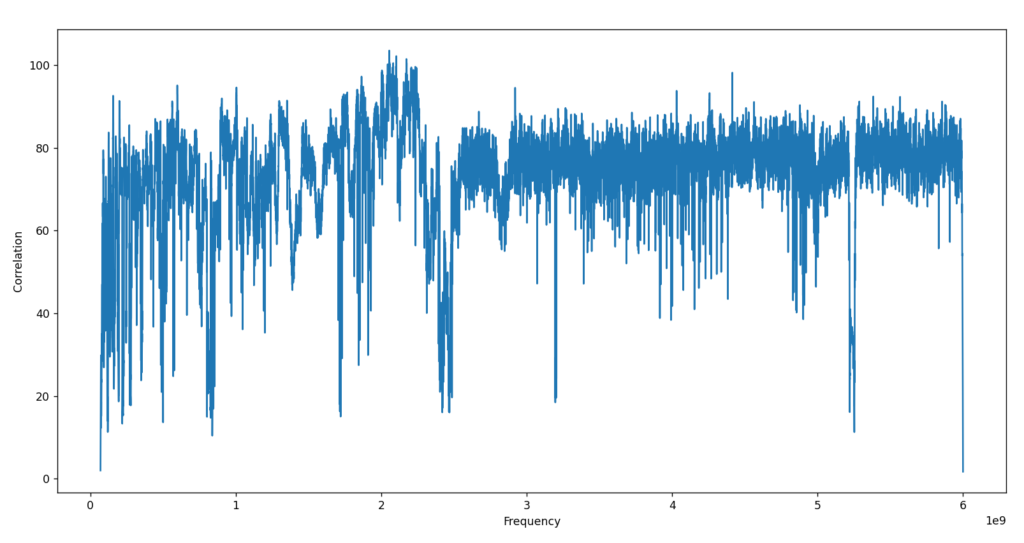
Here one can see what frequencies correlate the best with that cyclic signal. The region I stated shows the highest correlation, but it is much narrower that I originally stated. Yet, in some ways most all frequencies show correlation except those I’m fairly certain have active signals on like 802.11 (2.4ghz). Still that specific region, 1.69ghz to 2.34ghz, shows the highest response.
I think I might have seen a response at 2.4ghz but I know there are active signals in that region likely suppressing the background radiation.

Here is a version with some smoothing applied. At about 2.12ghz there is a big dip down, but I believe there is some signal present there in the spectrum.
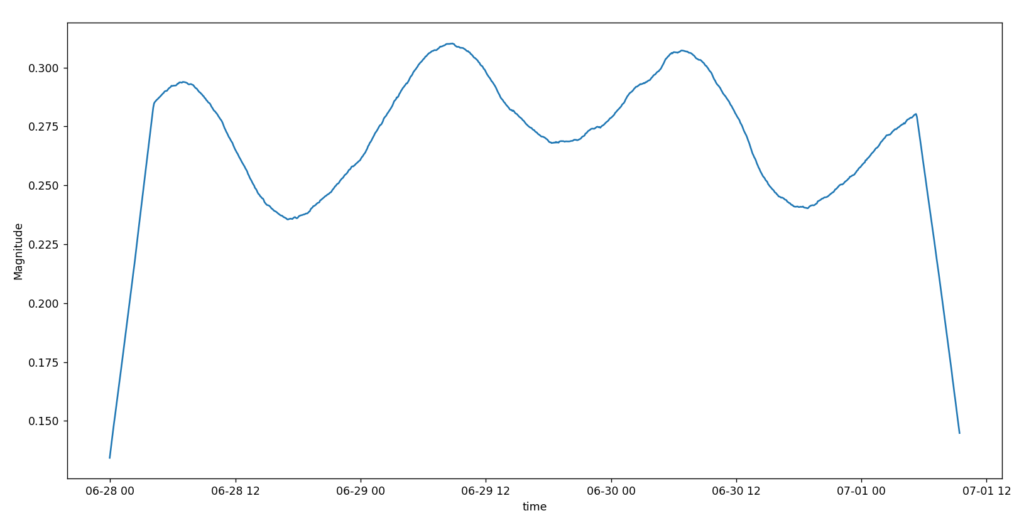
If I take all frequencies, I also get a very similar plot. But when correlated across all frequencies it shows the most attenuation happening at the highest frequencies which is somewhat how I would actually expect it to work.
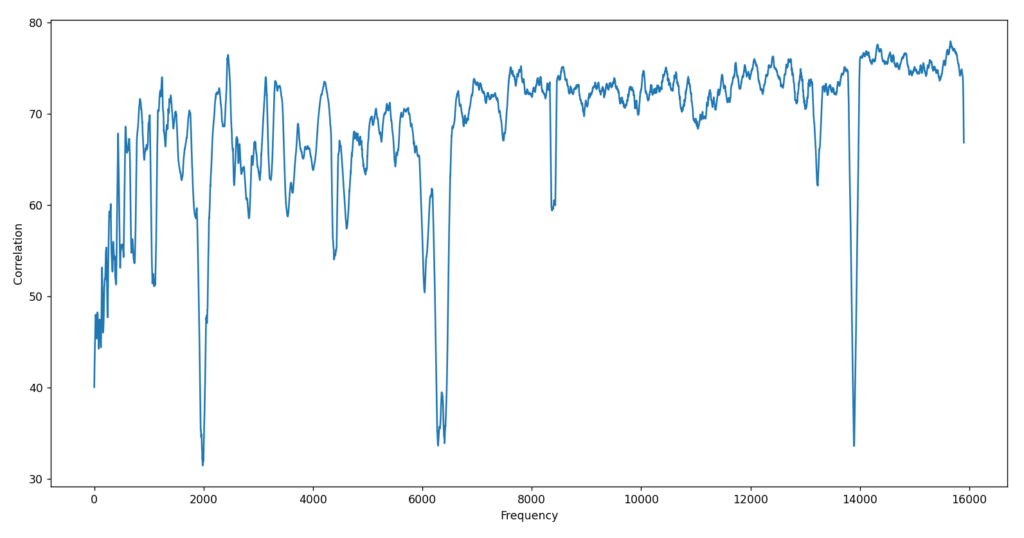
You can see the gradual matching of the daily cyclical pattern gets higher as the frequency increases.
I suppose I will have to plot the humidity levels alongside the data and see if they correlate well.