I was operating under the assumption that two signals transmitted from two different location at the exact same time would be received at potentially different times depending on where the RX antenna was placed. Then I assumed that their phase would also be different if the distances were different even if the distance wasn’t great enough to produce a whole sample difference.
Now, if we consider only objects that reflect then it would be easy to see that both signals are likely to be reflected and the maximum difference in phase would be related to the original TX antenna locations relative to the RX antenna. The only effect that would give erroneous results is one in which reflections arrive from difference reflectors containing only one of the signals since in all other cases every reflection should in general be of both signals.
One edge case is when the arrival of both signals splits a sample. Such that the arrival of one signal from a specific reflector arrives and then the second signal arrives at the next sample. Depending on the method used this could be a problem.
I’ve utilized the simple method of taking the correlation of both signal replicas to the recieved signal then comparing phase difference per sample. This is problematic as I stated for reflections which arrive at two seperate samples. It would seem that this could create some type of banding in the output.
Experiment 1
For a specific experiment, the sampling rate was 2-MSPS and two signals were generated with each being 100,000 samples in length. Each signal was a linear chirp. One signal extended from 1e3-hertz to 25e3-hertz and the other 50e3-hertz to 100e3-hertz. These were emitted from two seperate TX antennas at the exact same time. A third antenna was used as an RX antenna. The RX antenna was separated by 10/16ths of an inch from one TX antenna and 20/16ths of an inch from the other. The antennas were in a line.
The close spacing of the antennas and the low sampling rate mean that most reflections will arrive at the same sample and in this case phase difference of zero means the reflector was along a straight line extending with a perfectly equal distance between the three antennas. Any deviation from phase difference of zero indicates the reflector was to one side or the other with maximum phase deviation existing at broadside of the three antennas.
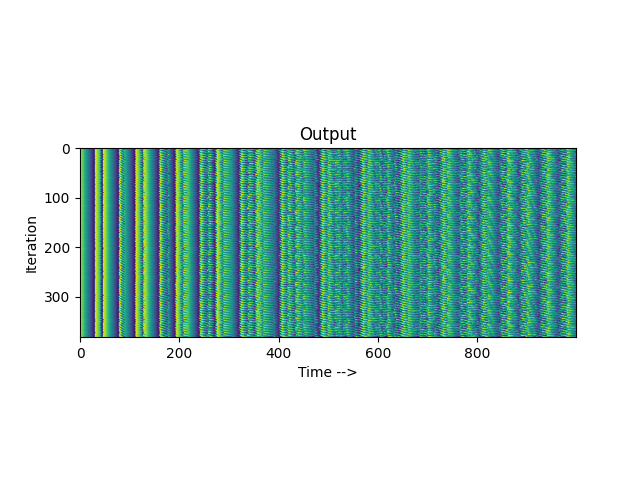
In figure 1, the output from the phase difference is shown over time. There is not much interesting about it over time. It seems to show the same output on each iteration. The banding appears repetitive, but it does exhibit what appears to be a decay over time as if there is some response to distance. It is obvious the two signals are having an effect because there is a clear decaying of the pattern.
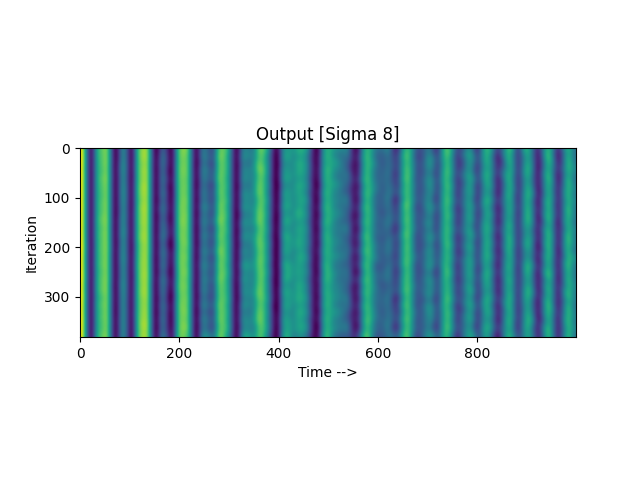
In figure 2, the output was run through a Guassian filter with sigma 8 resulting in a 2D low pass filtering operation. This removed a lot of the high frequency noise. The banding is now more clearly seen but there is still some decaying of the pattern.
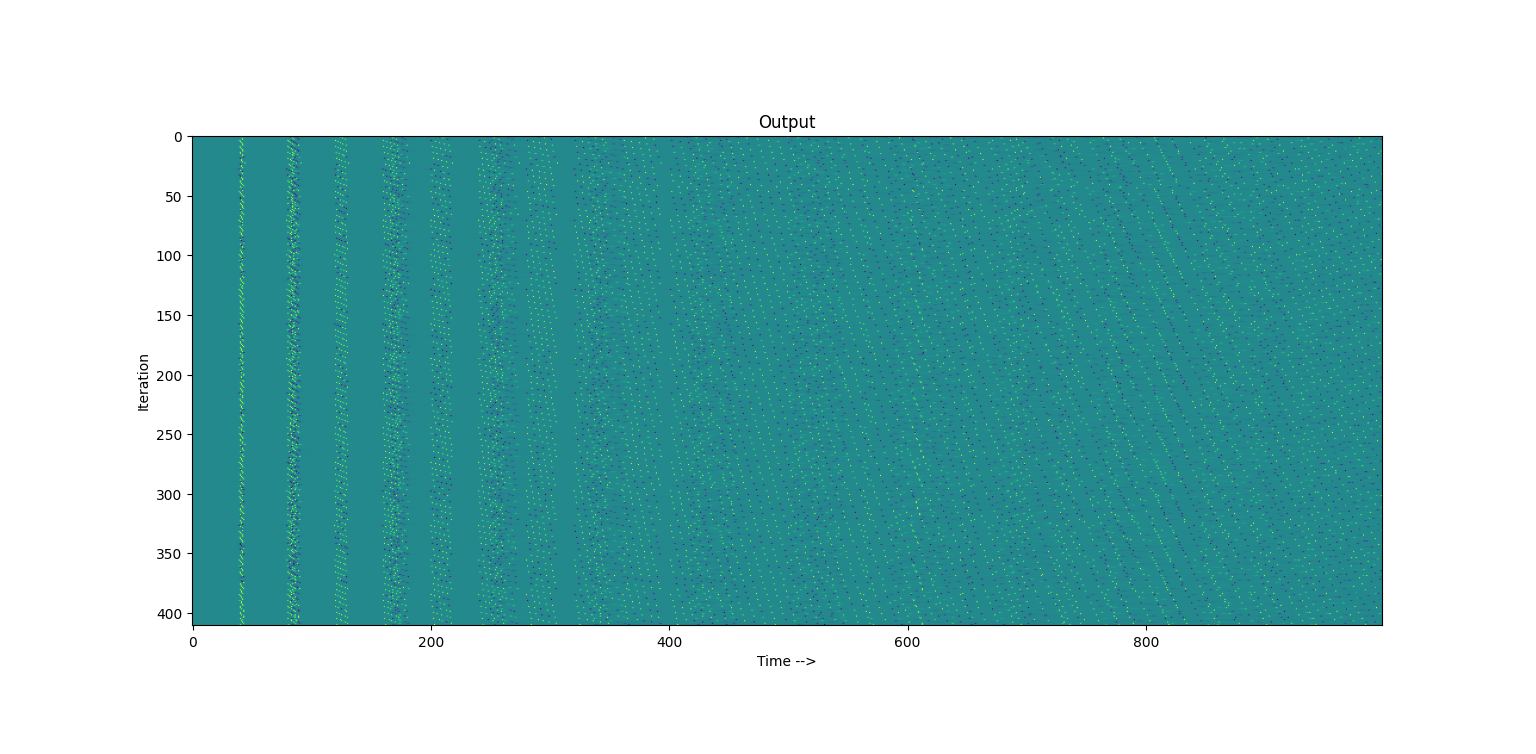
In figure 3, the phase difference between successive samples is taken. This stops the rolling phase in figure 1 and 2 from being visible and shows what is riding on the top information wise. The same banding is visible but now one can see ever increasing band widths. It is evident that there is information there but what it means is unclear.
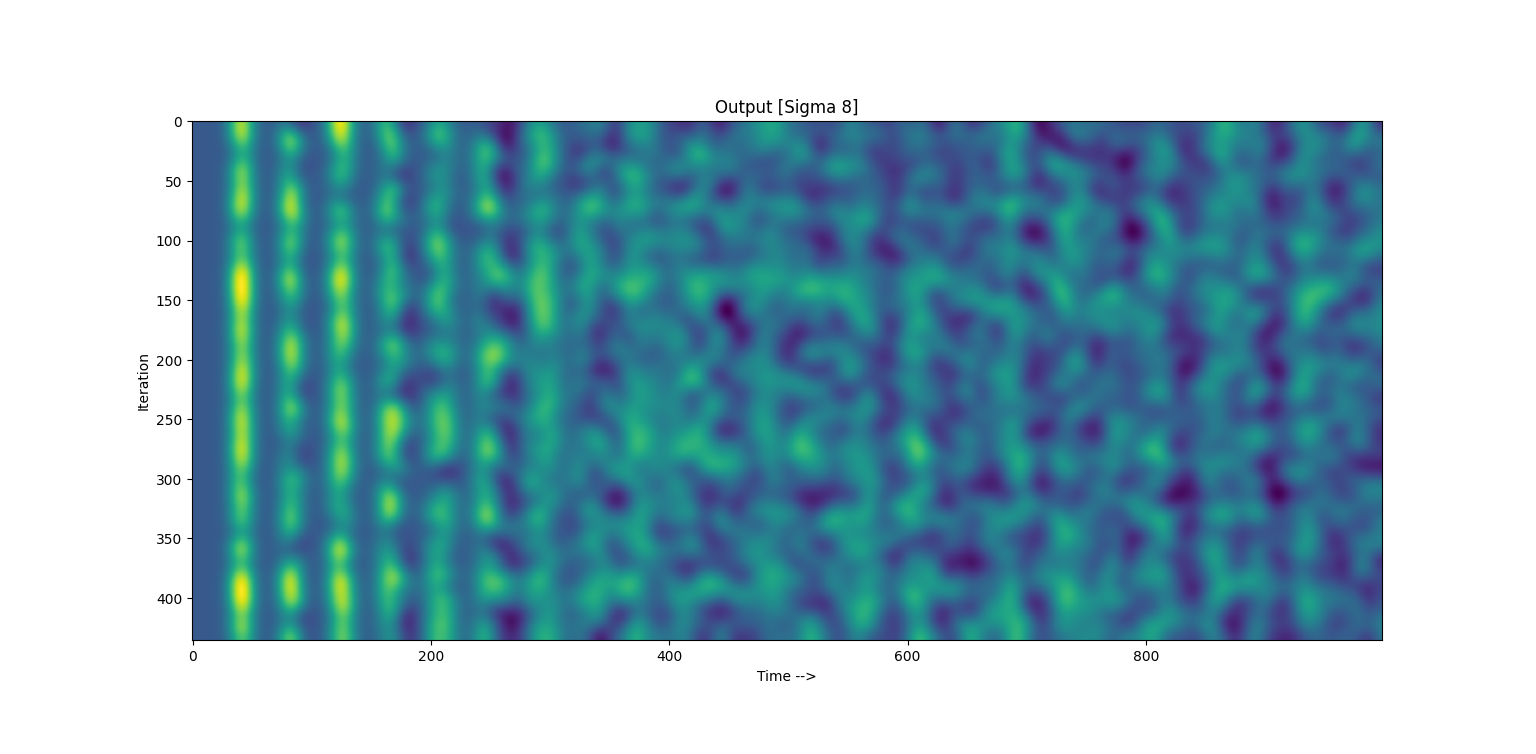
Figure 4 shows a low pass filtering of figure 3. It is clear that there are places where the output is changing in response to a change in the environment being tested but the reasoning and meaning is unclear.
Experiment 2
The parameters were tweaked. In experiment 1, the bandwidth was 200e3-hertz for the baseband even though the sampling rate was 2-MSPS and it was realized that linear chirp 2’s edge at 100-khz was really close so the chirps were adjusted to (10e3, 40e3) and (45e3, 75e3) for their ranges. The sampling rate was reduced to 520834 to decrease processing time and increase the testing rate. The signal sample length was increased to 200e3 samples for an increase in power/range. The main intention of the changes were to yield an increase in SNR to try to coax some information out into the open.
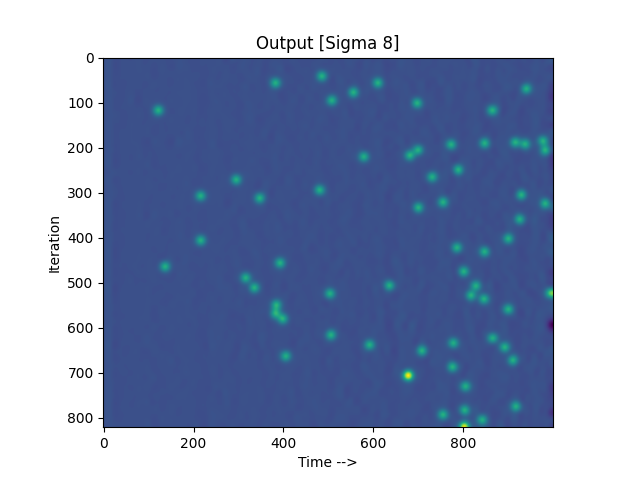
An interesting output can be found in figure 5. There are discontinuities present are where the phase delta between successive samples jumps abruptly. The cause is unknown.
Experiment 3
A few other undocumented experiments were performed. All lead to the same outcome. Either the output was showing variation, or the variation was abrupt discontinuities in the successive phase delta transform in the form of dots. In experiment 3, the RX antenna was switched out for a log periodic, the TX antennas were placed horizontal, and the RX antenna was aimed upward toward the sky.

The chirp ranges were changed to (-200e3, -1e3) and (1e3, 200e3). The bandwidth was set to 400e6 and the sampling rate was set to 520,834-hertz.
Conclusion
The experiment failed to produce the expected results and no explanation was determined.